

Exclusive duty free shelf data that drives growth
Travel Retail Quarterly Tracker
Dashboard access to SKU-level data from our ongoing audit of 100+ global duty free stores. Track compliance, pricing, and promotional space under your brand's specific rules.
70+ airports. 100+ stores. One consistent standard.
One methodology, applied identically in every location — so São Paulo and Singapore are genuinely comparable, wave after wave.
Track share of space, benchmark international price ladders and audit promotional compliance at scale, on human-verified data your team can confidently act on.
Tracking the four major travel retail categories
We capture data from every fitting and fixture in 100+ global travel retail stores.
Alcohol
Confectionery
Beauty
Tobacco
How It Works
We apply the same global methodology across every location, making results directly comparable wave after wave.
Configure Rules
Provide your priority SKUs, Must Stock Lists, and target share of shelf at setup to establish your custom dashboard parameters.
We Capture
Our global field team uses the Shelftrak app to capture the fixtures in 100+ stores every single quarter.
AI Analyses
Our proprietary VISTA AI model processes each image down to SKU level in seconds: products, facings, positions, prices and promotional materials.
Automated QC
Our system flags any inconsistencies (e.g., promotional stickers, packaging variations) for further review.
Human Verification
Our experts review flagged items, ensuring near 100% accuracy while maintaining speed and scalability.
Insights Delivered
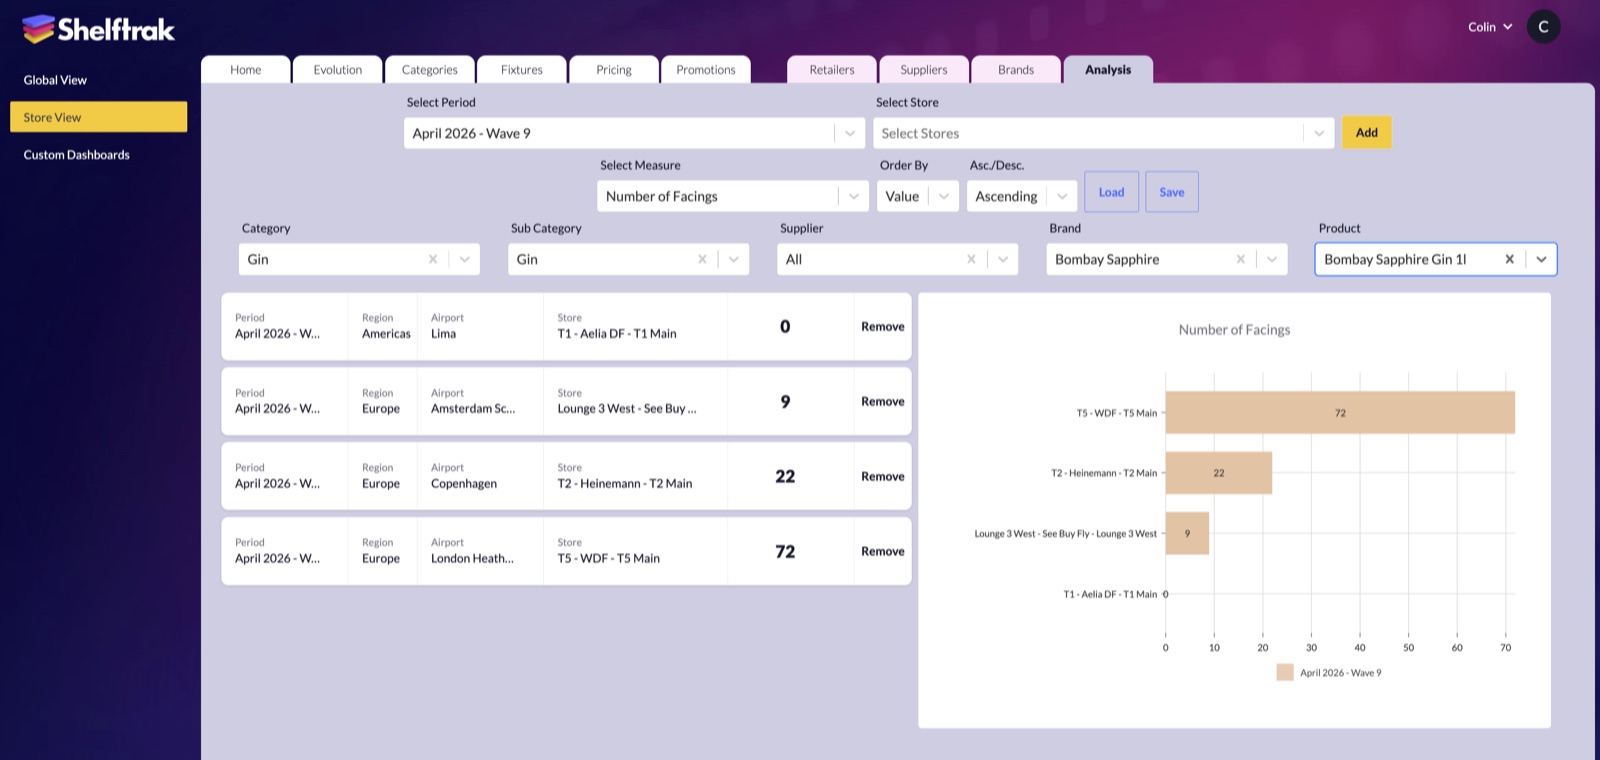
Each wave is added to our dashboards. View and compare globally or by region or store. Drill to a single fixture, or track a competitor’s space.
The metrics that make the shelf a quantifiable asset.
Commercial metrics built from physical shelf checks, giving your team the evidence to protect listings and negotiate fair space.
SKU Density Ratio
How hard is each metre of your fixture working? SDR measures SKU and facing concentration against physical space — the core economics of the shelf, quantified.
Must Stock Lines Compliance
Your priority SKUs, checked in every store, every wave. White space is flagged instantly, so missing listings get fixed before they cost you sales.
Share of Space vs Market Share
The fairness test. If you hold 20% of the market and 12% of the shelf, you have a negotiation to open — and the empirical evidence to win it.
Bring the store to your desktop.
Mapped store floor plans sit side-by-side with high-resolution fixture photographs, allowing your commercial teams to verify pricing, positioning, and promotional execution without travelling.
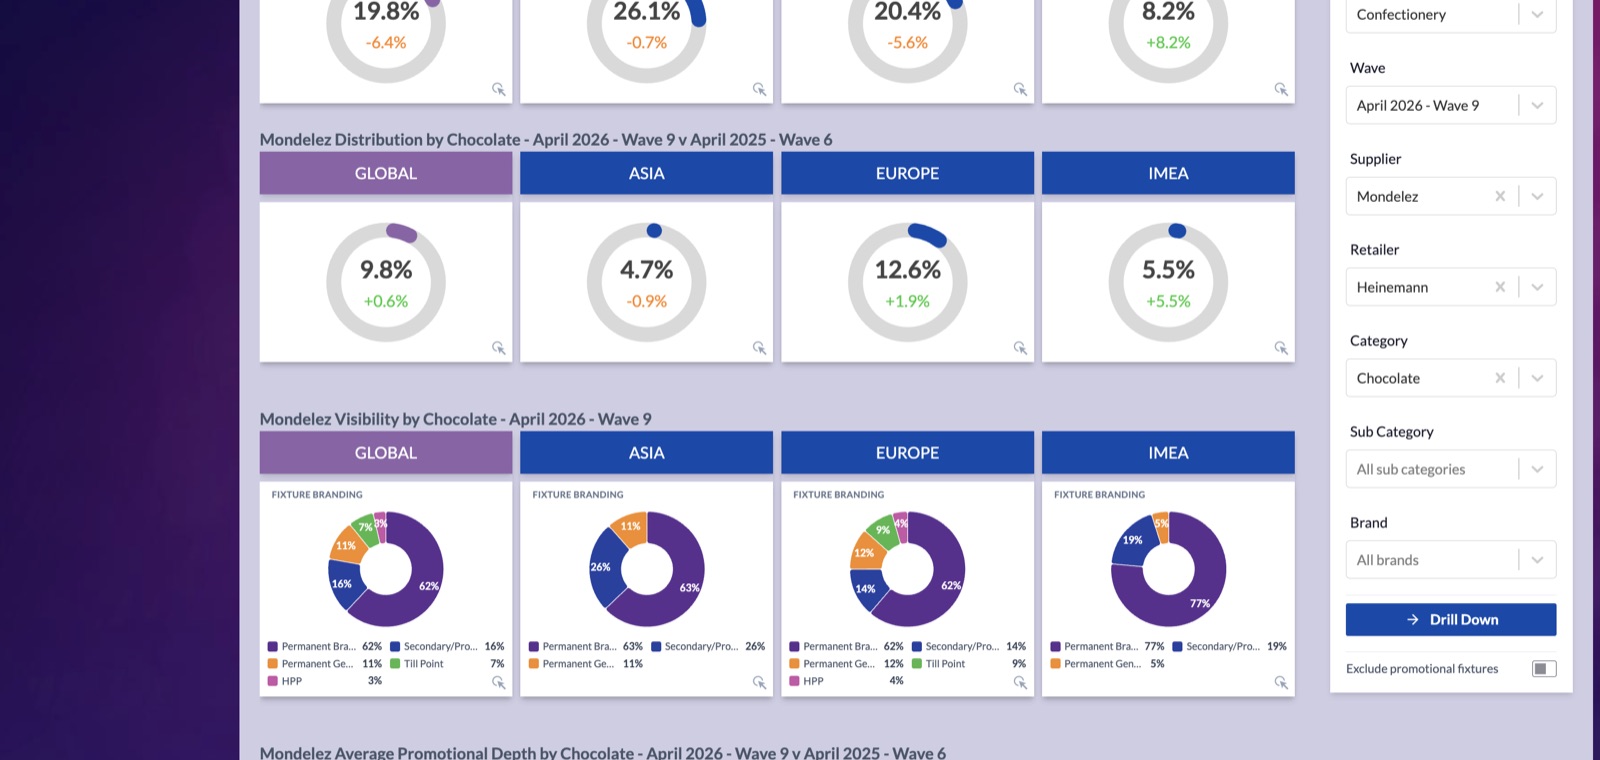
Share of space, distribution and visibility, region by region — any wave against any wave.
Case study
Tequila Patrón — Securing category share across European airports
Benchmarking Patrón’s share of Tequila space across eleven European airports exposed a single location — Frankfurt — costing the brand its fair share of the category.
Read the case studyLorem ipsum dolor sit amet, minim molestie argumentum est at torquatos.
Apeirian detraxit pri eu. No solum accusam has. Ius ne harum mundi clita, eu pro tation audiam.