

Case Studies Confectionery Haribo
Haribo holds 25% of sugar confectionery space worldwide. In Istanbul, it holds 3%.
A Shelftrak global snapshot compared Haribo’s space, range and facings across thirteen key airports from Heathrow to Delhi — and showed exactly where the brand’s linear metres fall short of fair share, region by region.
- Client
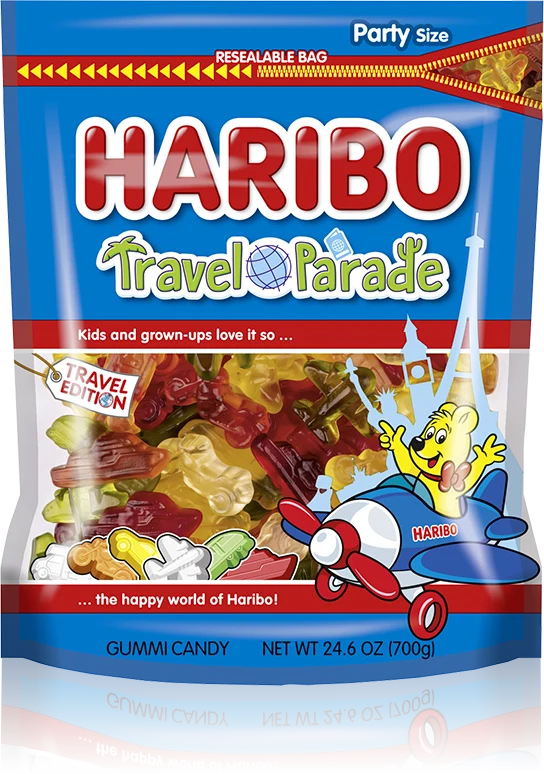
- Haribo
- Category
- Sugar Confectionery
- Scope
- 13 key airports, 5 regions
- Data
- Shelftrak audit, Aug 2024
The brief
One view of every key location, to decide where to look harder.
Haribo asked for a summary across all of its audited locations, on a selection of key metrics: how much of the confectionery fixture goes to sugar confectionery, how much of that goes to Haribo, how many linear metres and SKUs the brand gets, and how many facings each SKU is given.
The point of a snapshot is direction, not depth. Shelftrak reviewed thirteen airports across Europe, the Americas, Asia, MENA and Australia to show the commercial team where the deep-dive work should start.
What the snapshot found
11.9%
Sugar confectionery holds 11.9% of confectionery space globally — with Asia lowest at 5.3%
26.1%
Haribo holds 26.1% of sugar confectionery space globally — with MENA highest at 36.3%
0%
below the European average share of sugar confectionery for Haribo in Istanbul
Finding 01
The segment’s share of the fixture varies fourfold by airport.
Sugar confectionery holds 27% of confectionery space in Oslo and 4% in Sydney. The Nordics give the segment the most room. Before Haribo’s own share is even measured, the size of the category it competes in is a regional decision.
Finding 02
Three locations stand out: Istanbul, Oslo and Cancún.
Delhi and Bangkok give Haribo nearly half of the sugar confectionery fixture. Istanbul gives it 3% — and Oslo, where the segment itself is largest, gives Haribo only 13% of it. These are the first places the commercial team should investigate.
= locations flagged for investigation
Finding 03
Linear metres show where fair share can be levelled up by region.
Copenhagen and Oslo give Haribo around twenty metres each. Istanbul, New York JFK and Sydney give it two. The allocation suggests regional fair-share gains are available — and that a regional standard, rather than a global one, is the right target.
Range and depth
Distribution is reasonable. Facings are where stock runs out.
Most locations carry between six and fifteen Haribo SKUs, so the range is broadly in place — but adding SKUs needs to be tied to space, not squeezed onto the same shelf. The sharper signal is facings per SKU: Istanbul and Sydney give each line two facings, and locations that low are likely to suffer regular out-of-stocks.
The recommendations
What the snapshot told Haribo to do next
01
Use the snapshot to direct the deep dives
This analysis is an initial view to highlight potential areas of focus: Istanbul, Oslo and Cancún first. Competitor analysis at each would show how to develop the position further.
02
Set regional targets, then track them
Linear metres and facings per SKU vary widely by region. A regional plan with standard targets, backed by ongoing measurement, would level up share across the key locations.
03
Lead the Sugar Confectionery segment
Sugar confectionery is under 12% of confectionery space globally and 5% in Asia. Haribo has a clear opportunity to set the vision and strategy for the segment and lead its development.
Take this case study with you
The full Haribo global snapshot as a PDF — all five charts and findings. PDF · 1.6 MB
More case studies
All case studies →




Lorem ipsum dolor sit amet, minim molestie argumentum est at torquatos.
Apeirian detraxit pri eu. No solum accusam has. Ius ne harum mundi clita, eu pro tation audiam.